-
 Lan Dam authored
Code owners
Assign users and groups as approvers for specific file changes. Learn more.
11 _ Save Plots.help.md 1.99 KiB
Save Plots
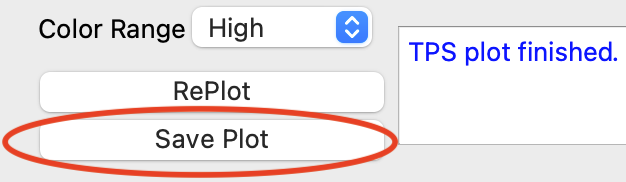
Step 1: click 'Save Plot'
In Main Window, Raw Data Plot and TPS Plot there are buttons labeled 'Save Plot'.
User need to click those button to save plots in each window.
- Saving State-of-Health plots
* Saving Raw data plots

* Saving Time-power-square plots
If the current color mode is black, user will be asked to continue or cancel to change mode before saving the image.

- If user click 'Cancel'. The process of saving plots will be canceled for user to change mode before restarting saving plots again.
- If user click 'Continue'. The process of saving plots will be continue and the image will be saved in black mode.
Step 2: Edit file path and select image's format
Once clicking on 'Save Plot' button, the 'Save Plot' dialog will pop up.
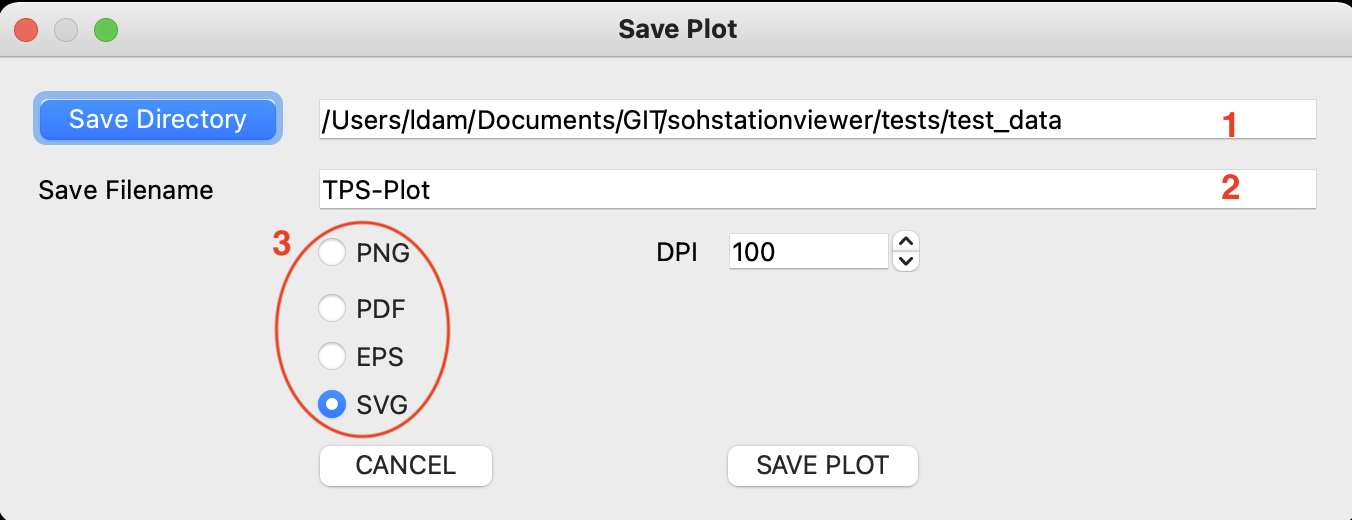
- The default path to save the image file is preset in (1) text box. If user wants to change the path, click on 'Save Directory button' to open file dialog for changing path.
- The default filename to save the image is preset in (2) text box. User can change the name in this box.
- In side oval (3) are the radio buttons to select image format to save file.
- For 'PNG' format, user can change DPI which is the resolution of the image. Other formats are vector formats which don't require resolution.
Then user can click 'CANCEL' to cancel saving plot or click 'SAVE PLOT' to save the current plots to file.